HTML VizCreator Flex for Power BI
PREVIOUSLY NAMED: HTML & CSS VIEWER

A MUST-HAVE FOR EVERY POWER BI DEVELOPER
Let the world be your oyster
The HTML VizCreator Flex visual is an extremely powerful visual because it can be used for nearly anything. Being able to combine DAX and HTML allows the user to create elements that seemed impossible in Power BI until now. With this visual, Power BI developers no longer need to say no to specific requirements from users. It is now possible to create nearly anything in Power BI.
No credit card required
Curious about some popular use cases of our visual?
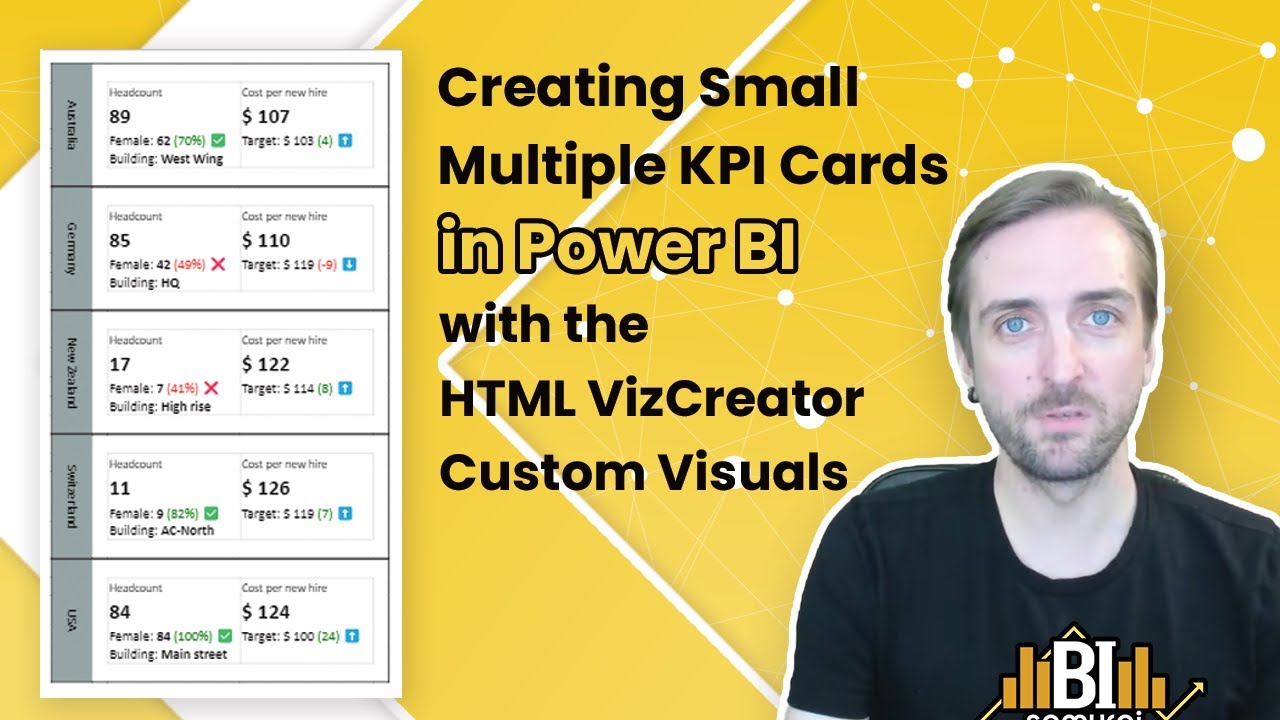
KPI Cards

GIFs

Tables

Tooltips

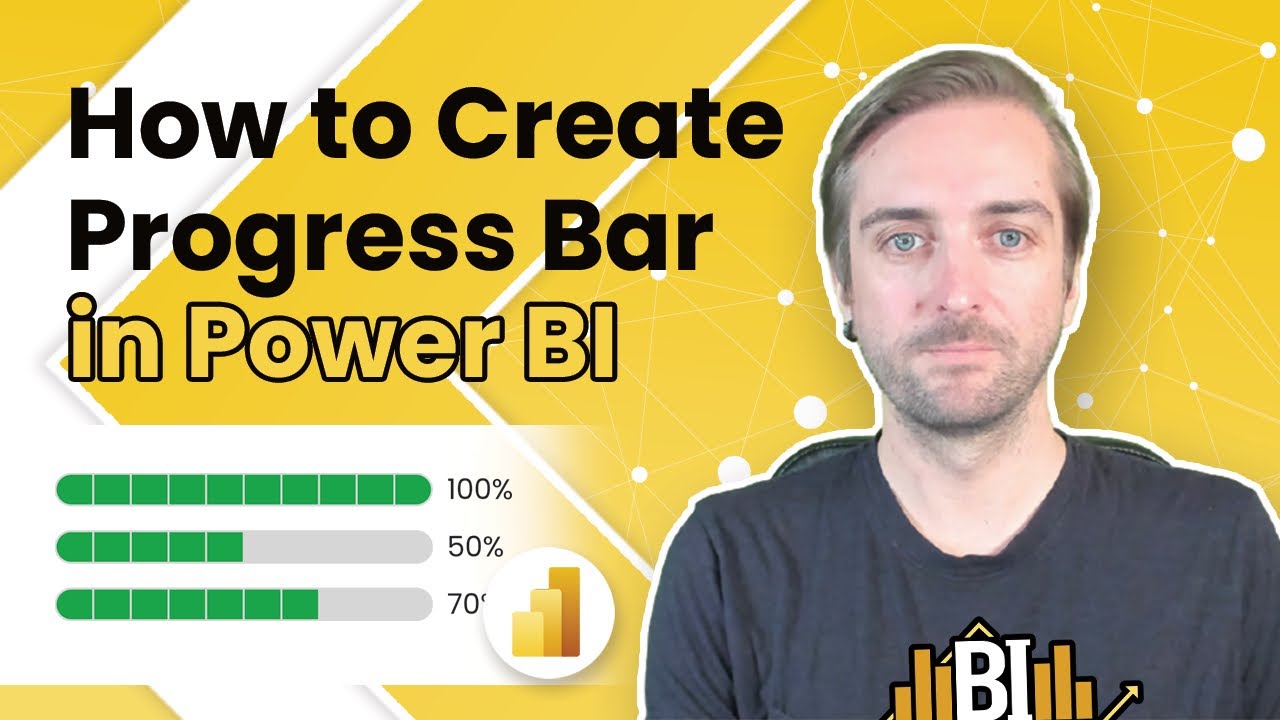
Bar Charts

Text

And much more...
Need some help to get started?
At BI Samurai, we understand that it might take some time to get started with the visual. This is why we are more than happy to help you.

A good starting point is our sample report. Download the PBIX and see if there’s a similar element to the one you want to create. If yes, simply copy and paste the code into your report and make adjustments.
Otherwise, visit our knowledge base (supported with videos) to learn how to use the visual or let one of our experts create the elemet you're looking for.


New to HTML? We’ve got you covered.
With the help of our HTML Editor and Image/GIF converter you require very limited HTML knowledge.
No credit card required
Why HTML in Power BI?
The HTML VizCreator Flex is one of the most powerful and versatile custom visuals in the market. It can render HTML code which means it can be used to create nearly any kind of visualization element. Combine this with the power of DAX and you can create some amazing storytelling elements or simply exactly the one thing you wanted to always have in your report.
Navigate through the sample report below or download it to see the visual in action and be inspired.
Advantages of HTML VizCreator Flex visual
- One visual to solve many problems.
- The combination of DAX and HTML lets you do powerful stuff.
- Out team of experts is happy to help you.
- It’s fun to use 😀
Includes free support from our team
- Support page
- Online Knowledge Base (with videos!)
- FAQ
- Free demo sessions
- Continuous improvement of the visual. See the changelog for details.
Try out our Sample report
See how you can improve your report with our HTML visuals for Power BI.
In case you want to create a similar element, there’s no need to create the code yourself. Just use the DAX measures from the sample report and adjust them.
Not convinced yet? See what our clients have to say
The most flexible HTML custom visual I've ever seen
The default visuals in Power BI have a lot formatting limitations and if you know a little bit about HTML, this custom visual provides a lot of cool ways to create your own custom HTML visual! I'm currently trying to create a HTML table to replace the default ones as it gives me so much control over the visual presentation and so far it's been a great experience. If you know or have worked with HTML in the past, definitely get this visual.
A must use visual
This visual must be a compulsory visual and must be pinned to your native visual. Makes your report come alive by giving flexibility and more options in your report.
The Do-Everything Visual!
This has become such a go-to visual for me that I now load it as part of my startup template so I have it available in every report. The flexibility of this visual is incredible, and with the free tools, templates and videos that BI Samurai provides, you barely have to know any HTML/CSS. The customer support is top-notch too. Highly recommended!
Take a look at some use-cases in action


Need a security guarantee?
The HTML VizCreator Flex visual is not Microsoft certified because we want you to be able to access external sources (like the internet) with it. If you require a visual that is Microsoft certified and can also render HTML, the HTML VizCreator Cert might be the visual you're looking for.

HTML VizCreator Flex Pricing
The HTML VizCreator Flex can be used for free in Power BI Desktop.
All users that view reports that contain our visuals in the Power BI Service must be licensed.
There are 2 ways to get a license:
- Order from Microsoft AppSource (You might have to contact your IT/Power BI admin to help you with that)
- In case you want to use our visuals in an on-premise Power BI Report Server environment, for Power BI Embedded or if there's any other reason why you would like/need to purchase directly from us, please contact us.
No credit card required
Related products
-
-
-
-
Power BI Visuals
HTML VizCreator Cert visual for Power BI (old name: HTML Text Styler)
From: $0.00 for 1 month