The International Business Communication Standards (IBCS) define how charts and tables should be designed and displayed in business reports. By following these rules, we make sure that everybody understands how the business is doing. This doesn't only save time but also makes sure that the right decisions are made on the basis of the shown data.
The implementation of reports according to IBCS requires the right tools. BI Samurai relies on the Zebra BI custom visuals for Power BI. We've been working with the Zebra BI visuals for many years and have a strong partnership with Zebra BI.
Zebra BI combines the most intuitive visualization tools to take your Power BI reports to the next level and deliver insight from your data in record time. On top of that, IBCS Reporting with Zebra BI also reduces the time which is needed to implement a report.
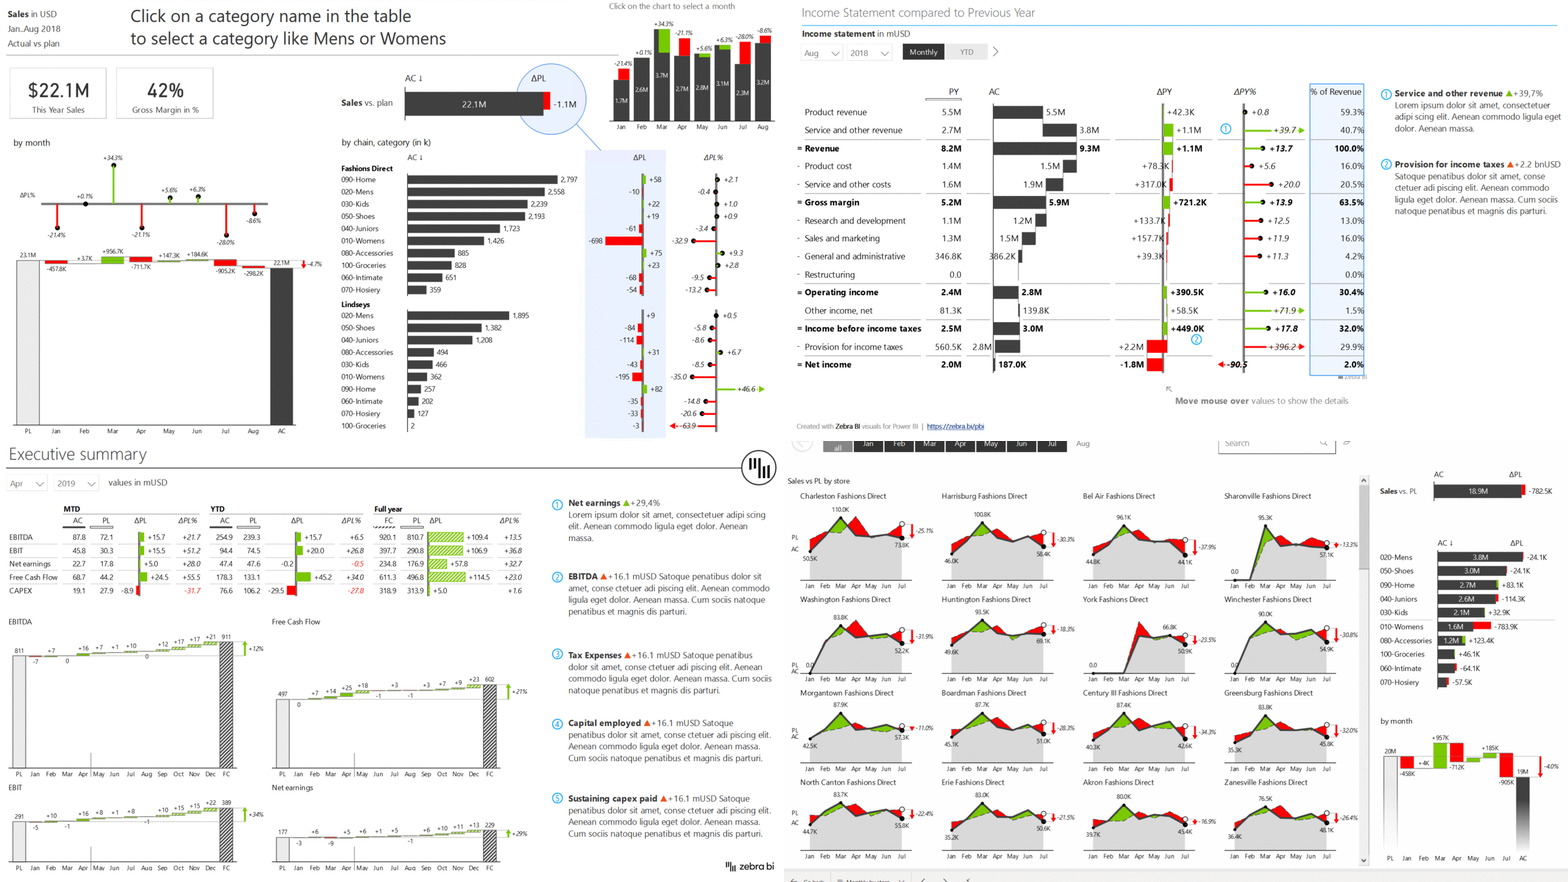
Top features of Zebra BI visuals for Power BI
The Zebra BI visuals are continuously improved and new features are added all the time. The list below is just a snapshot. In order to have the most up-to-date information, directly visit the Zebra BI website.
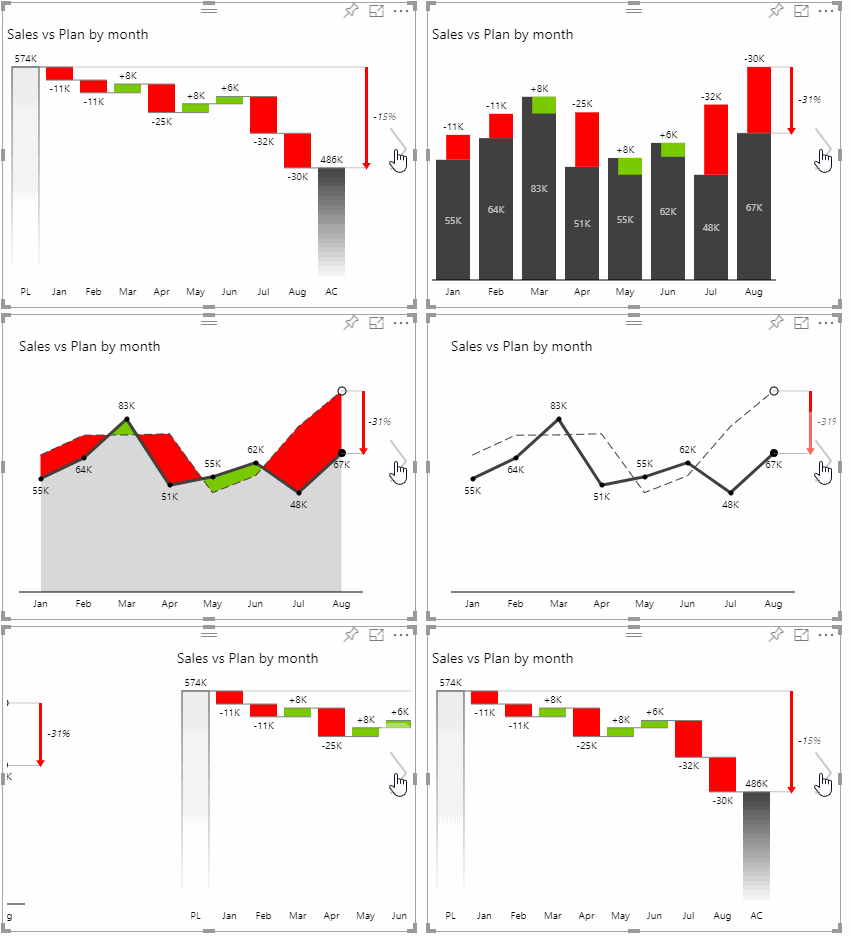
CHART SLIDER
The Zebra BI Charts visual contains different designs. Simply click on the arrow on the left or right-hand side of the visual and slide to a different view.
RESPONSIVE LAYOUT
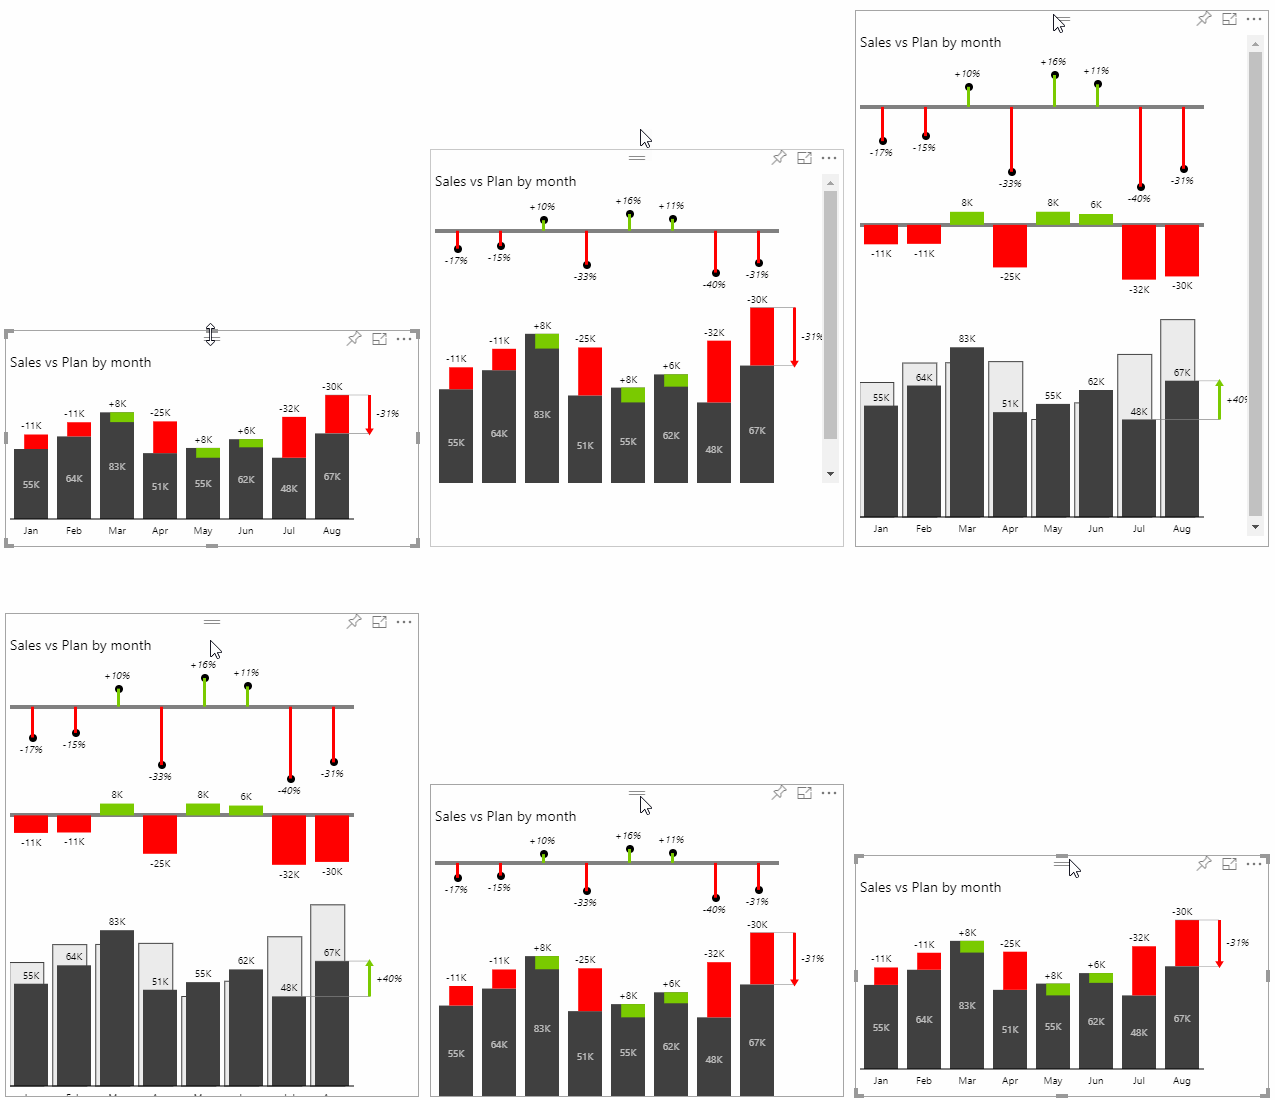
Both Zebra BI visuals are fully responsive so they make the best use of the space you have in your Power BI report.

CHANGING OF VARIANCE CALCULATIONS
With just one click, the user can change the calculation of variances

SORTING

In the Zebra BI Tables visual, different sorting orders can be applied by a simple click on a column header. In a hierarchical table with multiple levels, sorting is applied to all levels simultaneously.
SMALL MULTIPLES
Small multiples allow the user to compare multiple data categories on the same page. The Zebra BI visuals automatically scale all charts so they are compareable.

AXIS BREAK
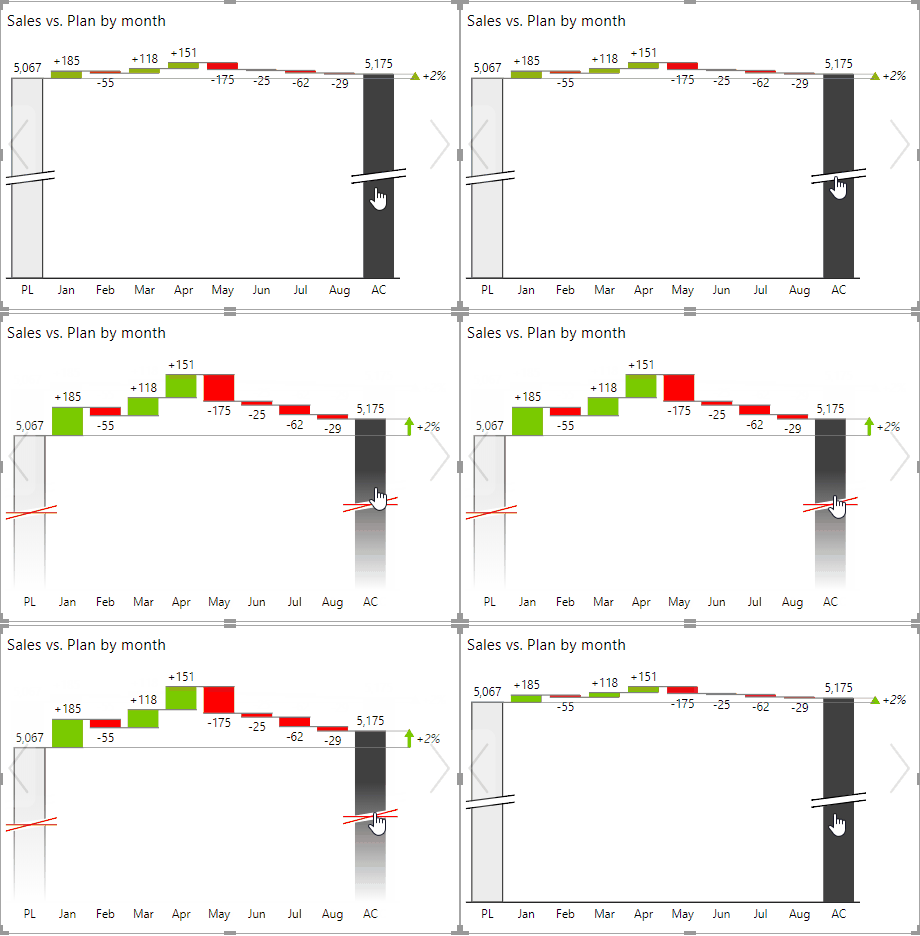
The axis break is helpful to present the contribution of data elements in a waterfall chart more clearly.
HIERARCHICAL TABLES
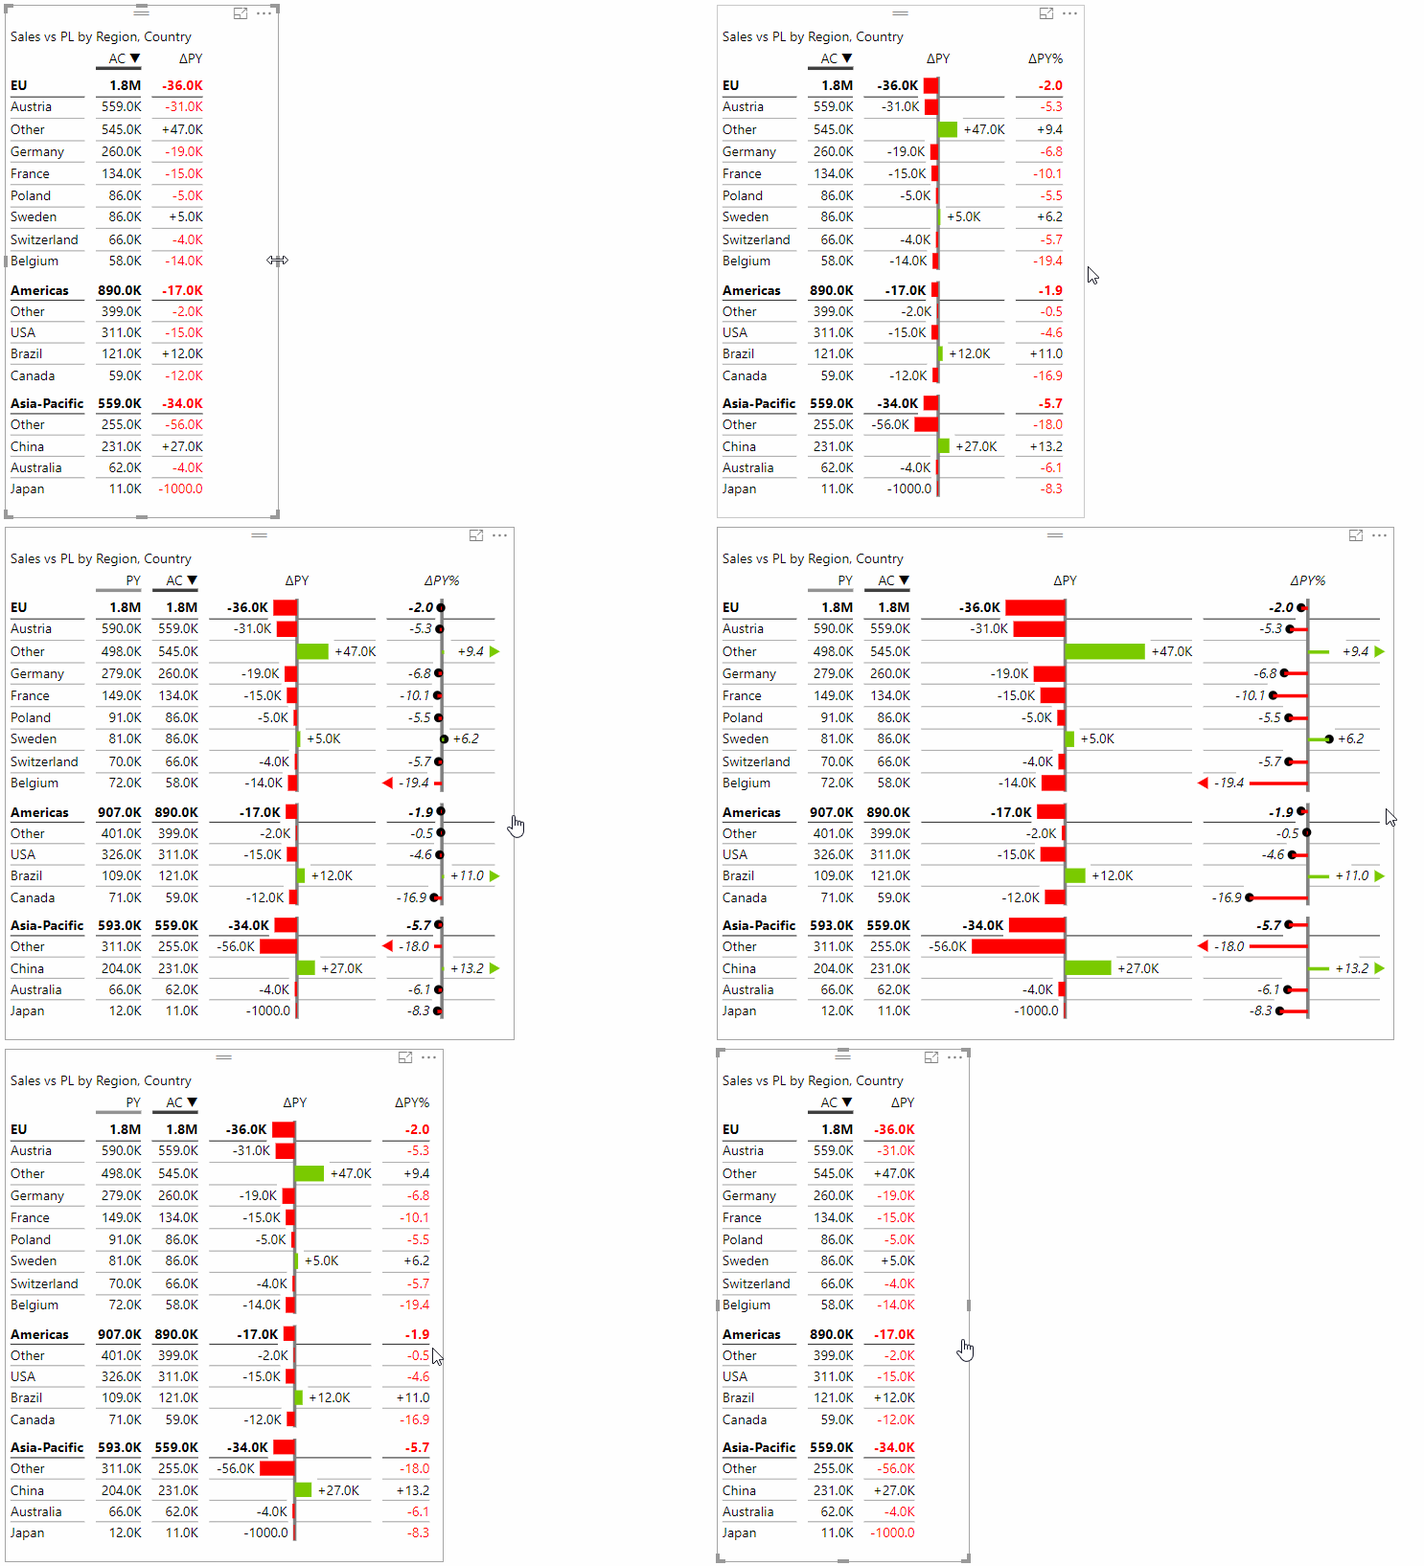
Hierarchical tables are fully responsive and will automatically calculate absolute and relative variances. These hierarchical tables are ideal for visualizing profit & loss statements and balance sheets.
EXPAND/COLLAPSE

The Zebra BI Tables visual allows to expand/collapse rows and columns with a simple click.
INCOME STATEMENTS (P&L)
User-friendly profit & loss reports are finally possible in Power BI!
With subtotals, invertible rows for costs and automatically calculated absolute and relative variances.
Zebra BI's vertical waterfall charts allow you to easily make sense of P&Ls, Income statements and pricing calculations.

SUPPORT FOR DR. HICHERT’S IBCS®

The Zebra BI visuals are fully compliant with Dr. Rolf Hichert's IBCS (International Business Communication Standards).
The IBCS standard design notation is rendered automatically, without adjusting any kind of settings!
FORECAST VISUALISATION
The Zebra BI visuals can display segmented charts. This allows multiple comparison points in the same chart, which is an especially suitable option for displaying forecasts.
A typical example of that is the comparison of both the actuals and forecasts to the budget in the same chart.

DRILL-DOWN

Drill-down allows the users to analyze the variances and other important values.
If a hierarchical dimension or multiples fields are added to the visual, the standard Power BI drill-down icons are automatically activated.
CUSTOM COLUMNS
Zebra BI Tables support adding custom-calculated measures to the existing columns in the table.
This takes the flexibility of Zebra BI Tables to the next level and enables users to create even more useful, informative and insightful reports.

WATERFALL CHARTS
The Zebra BI Charts visual supports waterfall charts with extremely flexible subtotals! The user can define which elements of the waterfall are results or need to be inverted.
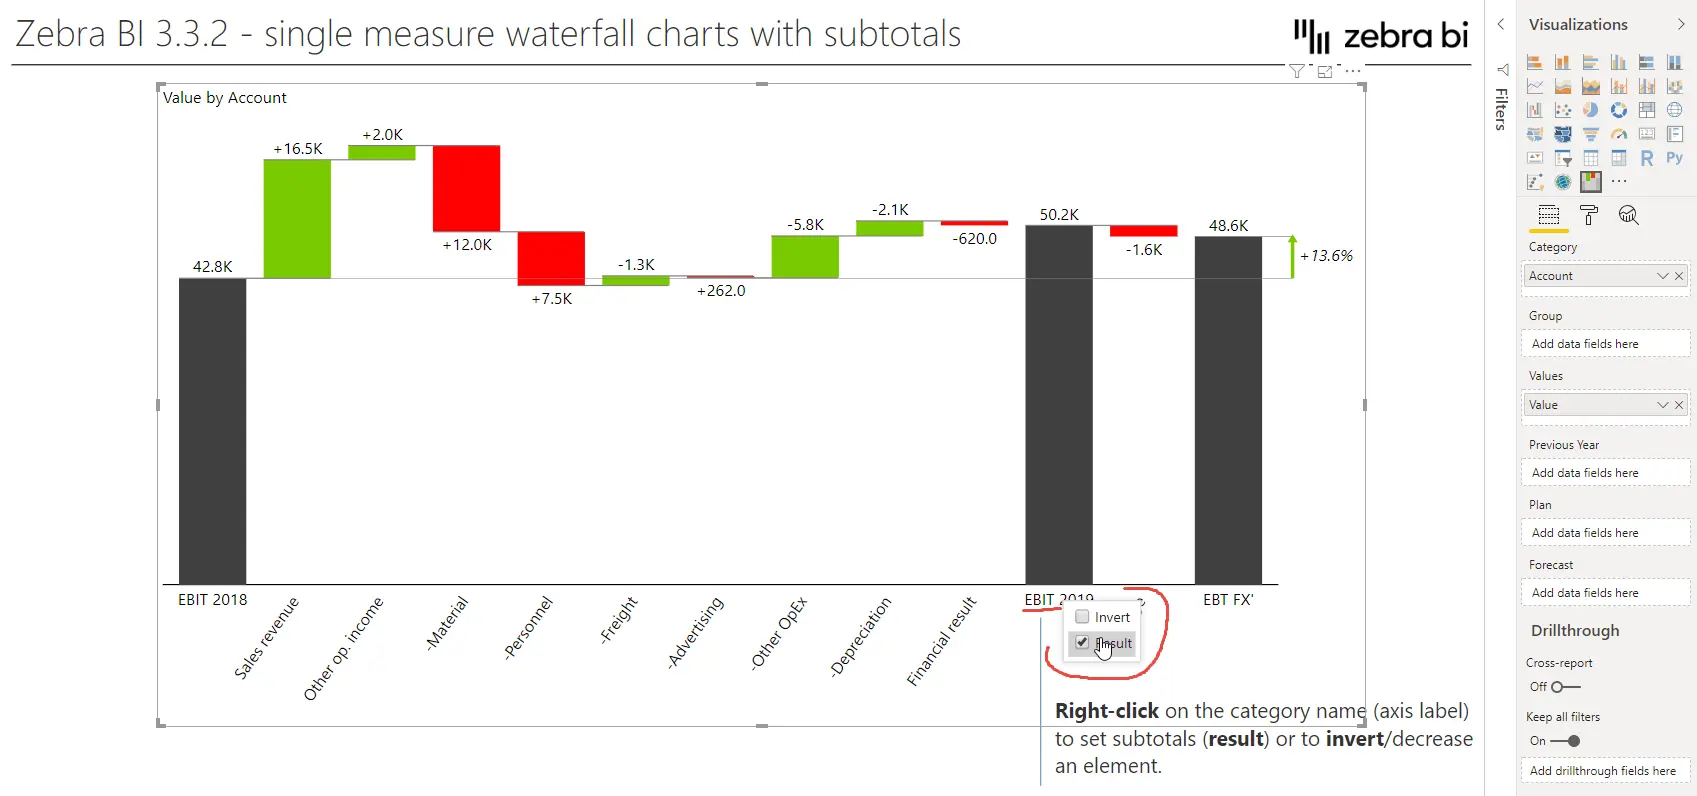
Of course, waterfall charts can also be displayed as small multiples

DRAG & DROP COLUMN ORDER
Renaming or reordering columns is extremely easy.

VERTICAL AND HORIZONTAL ORIENTATION

Depending on what kind of data is shown in a chart, it should be displayed horizontal or vertical. Changing the orientation of a chart can be done with just a click.
TOP N
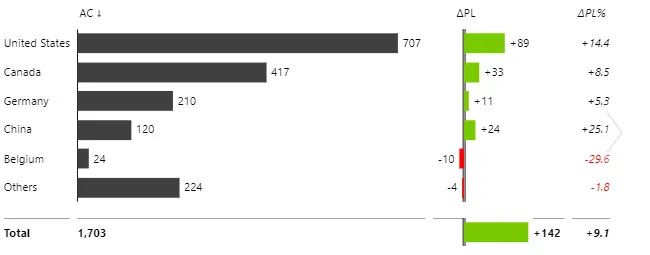
You can now limit the number of categories that are displayed in the visual. All the other values are shown as Others. This is especially useful when you want to highlight the categories that had the greatest impact on your business.
SWITCH BETWEEN CHART AND TABLE
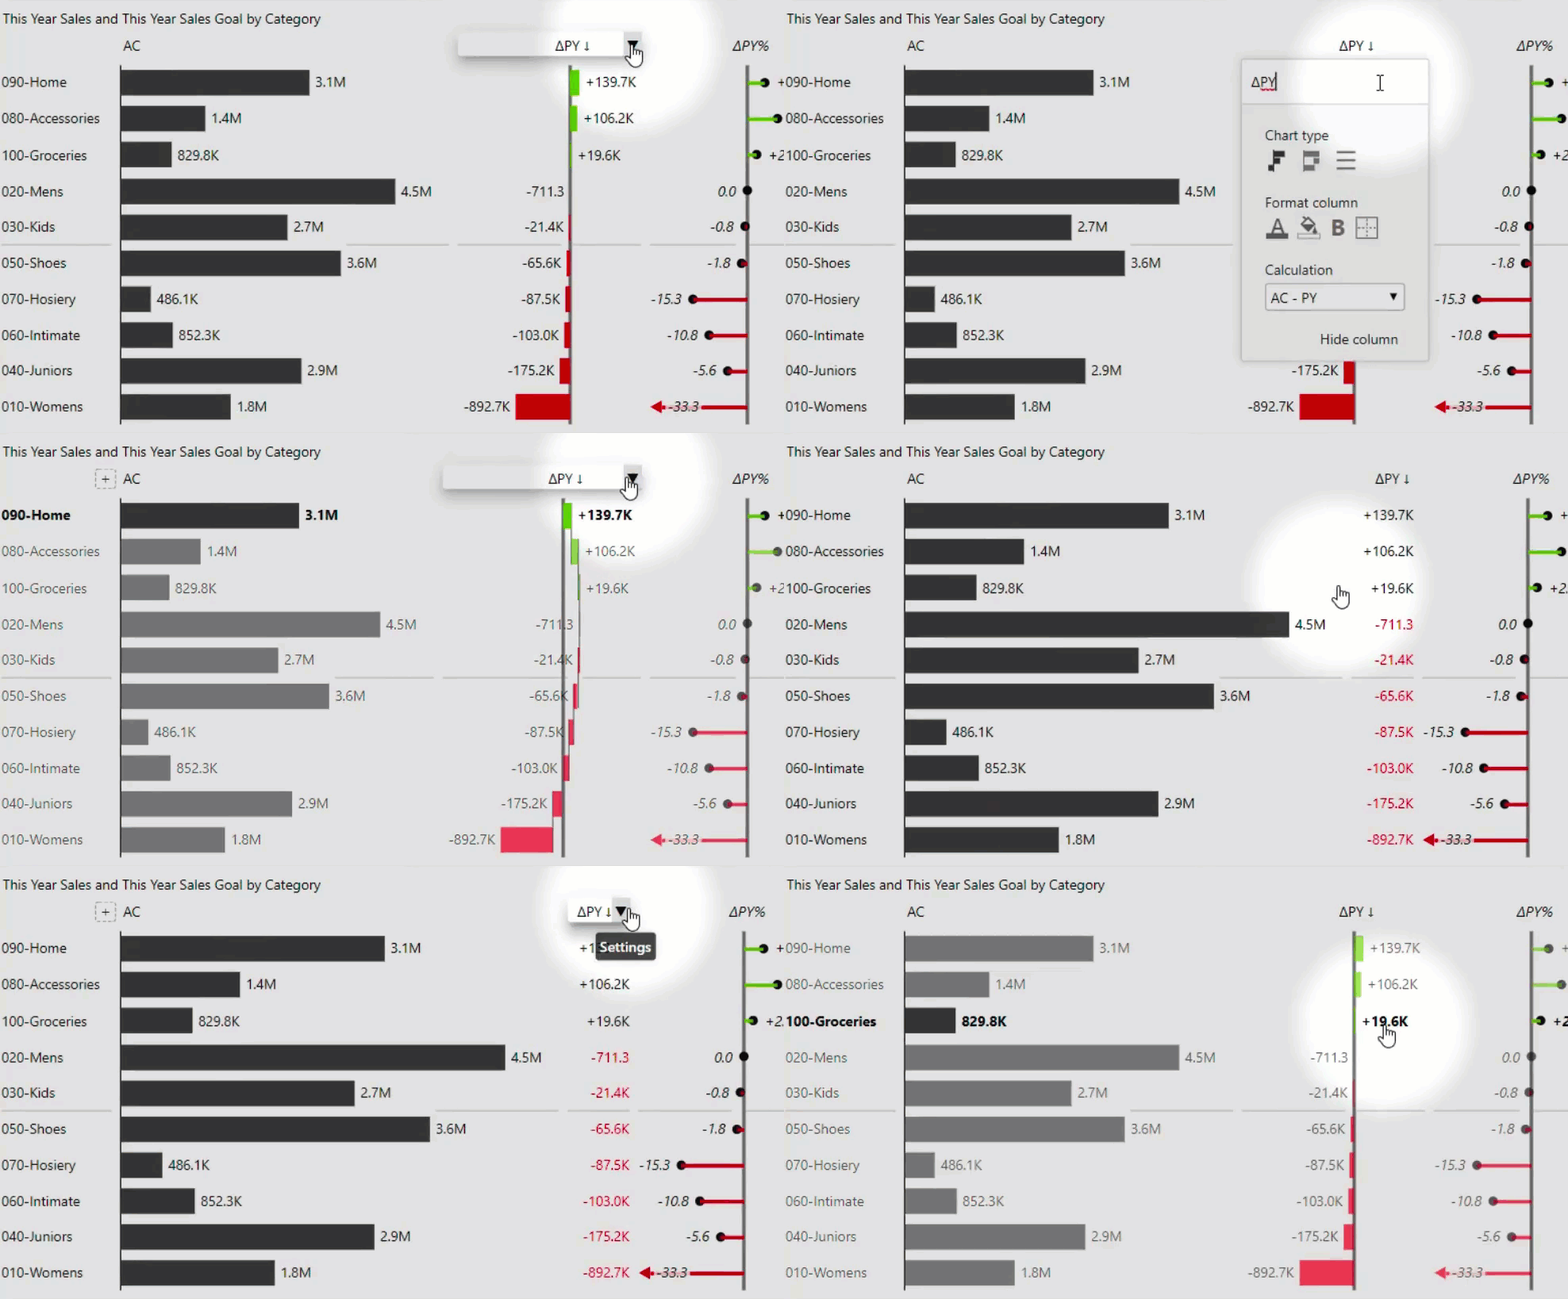
In the Zebra BI Tables visual, any column can be formatted in different ways.
4 DIFFERENT SCENARIOS IN ONE TABLE
The Zebra BI visuals work with the scenarios Actuals, Previous Year, Budget and Forecast. If needed, all 4 scenarios can be added to the same visual.

HIGHLIGHTING
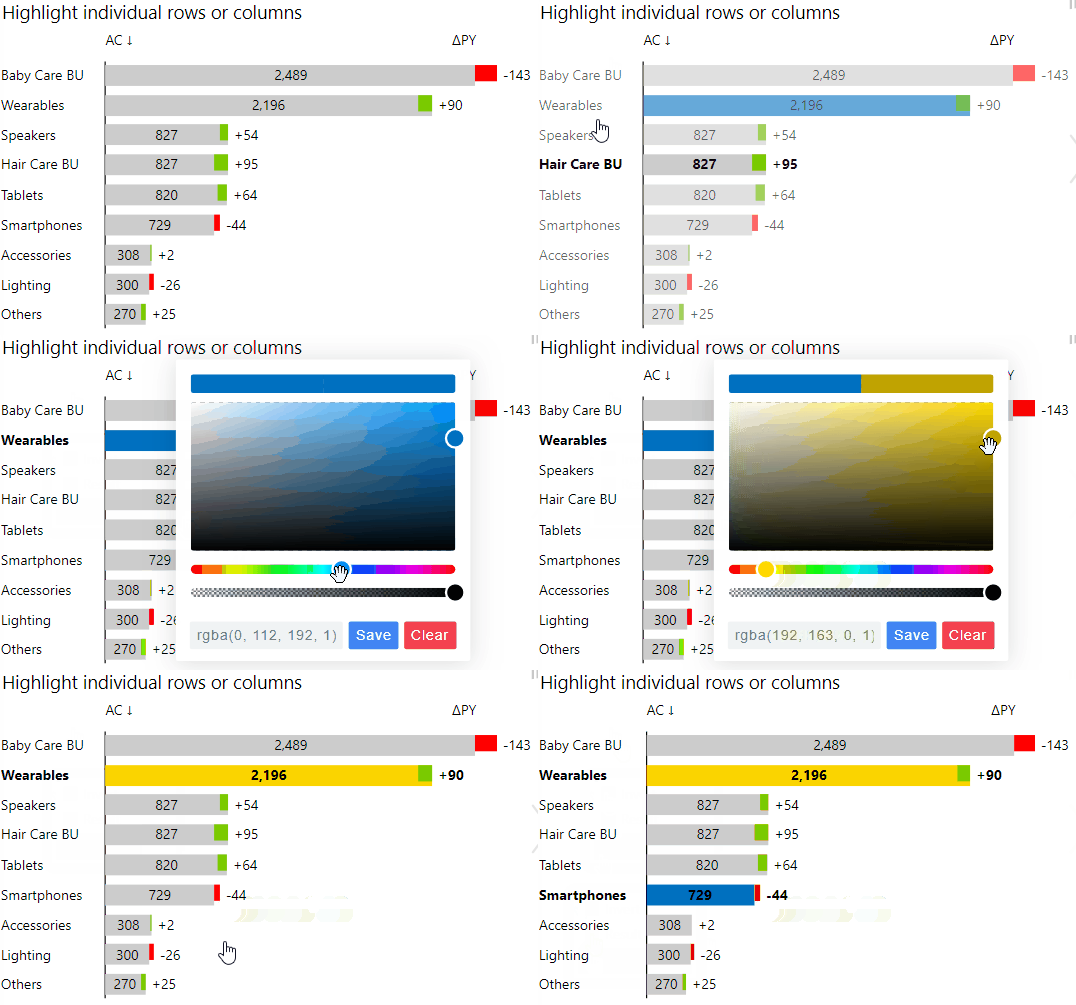
Specific categories or data points can be highlighted to let the end-user know, that there's something important to focus on.
By this point, you probably have some questions or would like to see what this looks like with your data. Click the button below to request a free demo. We're more than happy to answer your questions and show you Zebra BI in action.
