SVG Progress bar
The HTML VizCreator Flex visual can also display SVGs. This offers many doors as it allows us to display any kind of image and make it fully dynamic by connecting it to the data model. Our sample report which can be downloaded contains many samples of this kind.
One use case which is often used is to add a dynamic fill of elements. A good use case is a progress tracker willing up from 0 to 100%. This is exactly what our SVG expert Ali has done in the video below.
Of course stars are just one example. The sky is the limit when it comes to designing elements with SVGs. Sometimes, getting started with SVGs might be tricky, especially if you are a Power BI and not a design person. But don't worry, we've got you covered. Just let us know what you would like to create and we'll get in touch and help you out. Use this form to order your very own visualization element

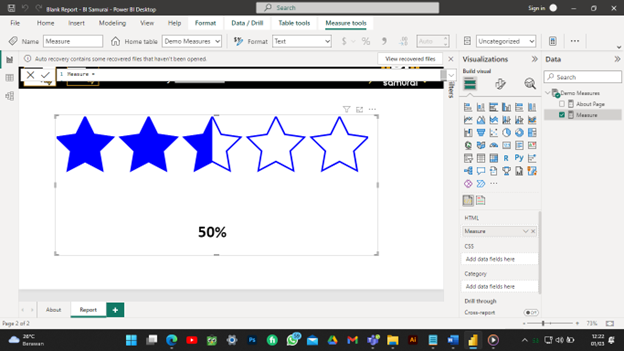
How to create star progress bar
- Prepare a star.svg (star shape) or create it using adobe illustrator

- Once you made the star.svg, right click on it and open it with notepad

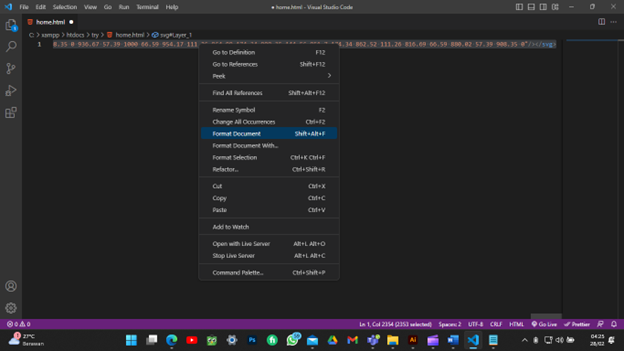
- Copy the svg code and paste into Visual Studio Code

- Select all (Ctrl+A) and right-click then click Format document
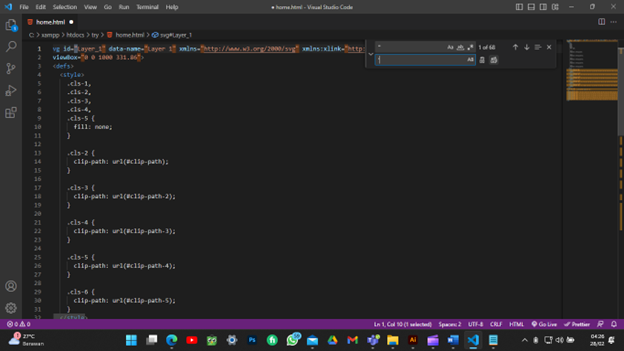
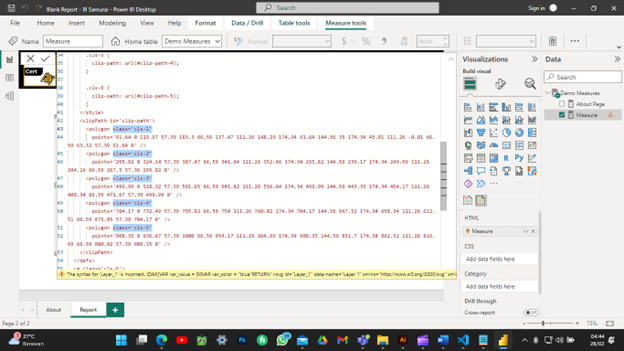
- Press Ctrl + F, change all the double quotes (“) in the code and replace them with single quote(‘)
- Select all and copy the code then paste it a measure in Power BI
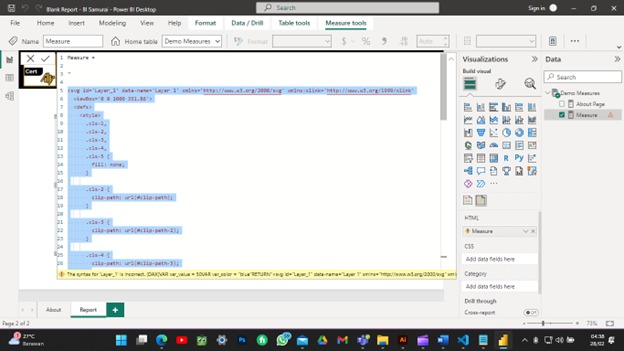
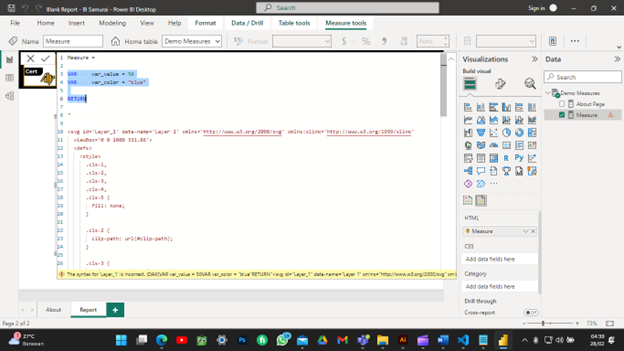
- Create variables
- Delete unnecessary lines
Delete the CSS classes

Delete others clipPath tag only need one clipPatch tag around the first 5 stars shapes

Delete star shape’s classes
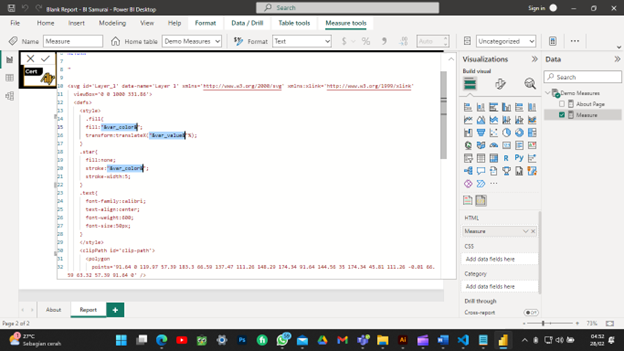
- Create new classes in CSS style tag and call the variable to change color and value
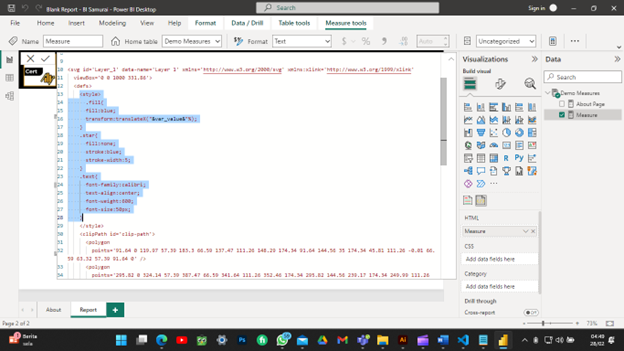
- Call the .star classes
- Call .fill classes

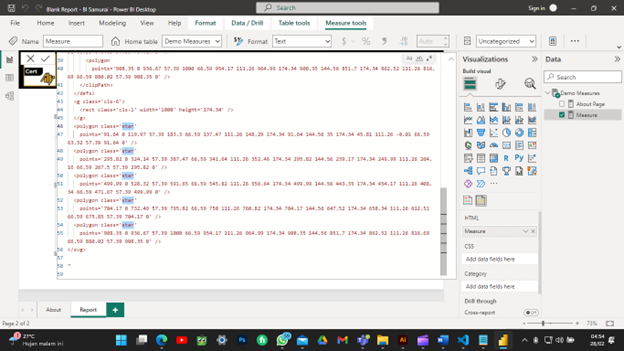
- Create a group to call the star clipPath by id

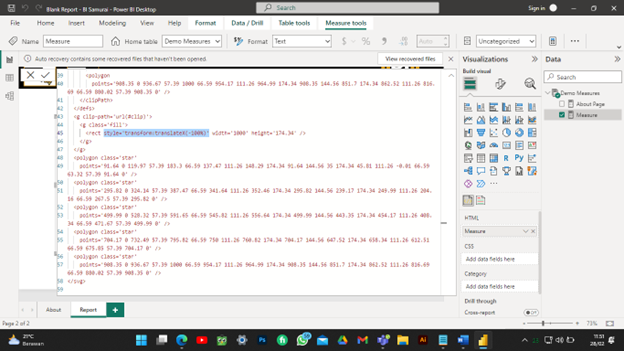
- Remove class=’cls-1’ inside the <rect> tag because we don’t need it. Then put transform:translate(-100) to move the bar (the rectangle) to the left and hiding it outside the star clip-path (outside the mask)
- Add text using <div> tag and put it outside the <svg> tag
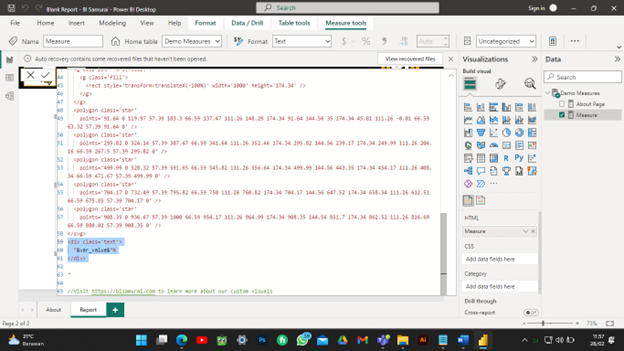
- Done!
Demo Report
Next up, you could learn how to animate SVGs in Power BI